Every ERP migration is a reporting migration, but nobody plans for it
One of the recurring themes we see at Tasman when working with organisations with a big ecommerce angle is how they deal with their systems of record. Clients working with us are almost always transforming one way or the other – and that often involves migrating to a better set of transactional systems.
And then we notice this: companies treat ERP migrations as system swaps. Replace SAP with NetSuite, move the data across, retrain the team, done.
But your ERP is not just a transaction processor. It is the gravitational centre of your reporting: the system your board decks, your month-end close, your marketing attribution, and your variance analysis all depend on. When you move it, everything downstream breaks. Not because the migration was poorly managed, but because your analytics were coupled to a single system in the first place.
That is a data centralisation problem. And without an ERP data migration strategy that accounts for your reporting layer, 2026 is the year it hits hardest.
And this is pertinent even if you’re not migrating for business reasons. E.g., SAP ECC 6.0 loses mainstream maintenance on 31 December 2027. Of the roughly 35,000 original ECC customers, Basis Technologies projects only 57% will have migrated by then. Gartner puts the backlog at over 22,000 legacy SAP Business Suite customers who have not yet acquired S/4HANA licences. This will be a traincrash for the downstream reporting if not handled correctly.
The companies that have migrated are not exactly success stories either. A 2025 Horváth study of 200 SAP user companies found 8% of completed S/4HANA migrations delivered on schedule. 8%. Projects averaged 30% longer than planned. 6 in 10 exceeded budget.
Gartner predicts that by 2027, over 70% of recently implemented ERP initiatives will fail to meet their original business case, with 25% failing outright. The ERP vendor’s scope ends at the system boundary. The reporting layer is nobody’s job.
So – what do we do about that at Tasman?
The ERP landscape in 2026
For European scale-ups (50 to 500 employees, Series A through C), the destination depends on who you are.
NetSuite is the default for VC-backed companies and e-commerce businesses. Oracle reports 43,000+ customers across 219 countries. It hit $1 billion in quarterly revenue for the first time in Q4 FY2025, growing 18% year on year. Enlyft data shows 54% of NetSuite users are businesses under $50M revenue. Gartner named it a Leader in the 2025 Magic Quadrant for Cloud ERP.
Microsoft Dynamics 365 Business Central has passed 40,000+ customers, with monthly active users up 75% year on year. If your organisation already runs on Microsoft, this is the path of least resistance.
Odoo is the European challenger growing fastest. 170,000+ enterprise customers globally, projected revenue above €800M in 2026, growing at 20 to 25% CAGR. Strong in Belgium, France, Germany, and the Netherlands.
Then there are the Shopify-adjacent tools (Cin7, Brightpearl/Sage) that handle inventory and order management but are not full ERPs. Companies outgrowing them typically land on NetSuite or Business Central. TradeGecko was discontinued after Intuit acquired it and folded it into QuickBooks.
The European picture varies by country
Germany is SAP territory. The ERP market there is worth $6.6 billion in 2025, 8.6% of the global market. Most mid-market companies have not migrated. DACH organisations favour on-premises because of data sovereignty concerns, though hybrid models are accelerating.
The Netherlands is shaped by Exact Online’s dominance among SMEs. SAP leads at 30.2% market share, Microsoft at 18.8%, Exact at 12.9% with 675,000+ customers globally, most of them Dutch.
The UK has Europe’s highest ERP market growth rate at 14.70% CAGR, projected to hit $12.975 billion by 2033. Post-Brexit divergence on customs, tax, and compliance rules is pushing demand for systems that handle multiple jurisdictions. The broader European cloud ERP market sits at $13.31 billion in 2025, on track for $63.69 billion by 2034 at 19% CAGR.
How reporting breaks during ERP migration
What the failure statistics actually mean
Gartner reports that 83% of all data migration projects either fail or exceed their budgets and schedules. Cost overruns average 30%. Time overruns average 41%.
Panorama Consulting’s 2025/2026 data is more granular. 23% of projects exceed budgets. The top causes: unplanned technology needs (50%), underestimated staffing (40%), organisational issues nobody anticipated (40%). At go-live, 51% of businesses report operational disruption.
“Failure” in ERP projects means different things: it can be over budget, over timeline, failed to meet expectations. Or even outright abandonment. Reporting continuity falls through every one of these cracks, because nobody scoped it as a deliverable.
What specifically breaks
The chart of accounts is one of the first casualties. When the CoA gets restructured during migration, every downstream financial report breaks. Companies face a binary choice: convert all historical data to the new CoA (expensive, but enables year-on-year comparison) or keep the legacy CoA for historical data (simpler, but kills comparative reporting). Most choose the latter.
Historical data rarely migrates cleanly. ERP vendors typically recommend against moving full transactional history. Master data can usually be cleaned and uploaded, but transactional detail is where things go wrong. Without documented mapping logic and validation checkpoints, discrepancies surface weeks after go-live when the financial reports do not reconcile.
The entire reporting layer disappears. A CPA at Velixo wrote about this in April 2026, and it is worth reading in full. The lessons: the data moves, the transactions move, the chart of accounts gets mapped. But the reporting that finance built and maintained over years stay behind. The account schedules in the new system do not cover the operational reporting, the variance analysis, the board packages, or the management reports that finance depends on every month.
Then there is the gap itself. The hard cutover blackout is 1 to 3 days, usually a weekend. But the effective reporting gap, where companies lack full visibility and fall back on manual processes, runs 2 to 6 months or longer. Finance teams end up in spreadsheets for consolidations and reconciliations, spending more time validating data than analysing it.
The case studies that make the point
A famous one is probably Lidl. Between 2011 and 2018, the German discounter spent roughly €500 million on an SAP ERP implementation, then abandoned it entirely. The reason is instructive: Lidl valued inventory on purchase prices; SAP’s standard used retail prices. A mismatch in how a single KPI was defined, at the most basic level, made the whole system unworkable.
GiFi is more recent and more visceral. In 2023, this French discount retailer (€1.3B revenue, 600 stores) launched an SAP ECC 6 migration. It went badly. Sales dropped about 9%, around €117M in lost revenue. A spokesperson told TF1 they no longer had visibility on their stocks, orders, or supplies. A company with €65M net profit in 2022 was pushed to near-insolvency.
Then there is the classic: Hershey’s in 1999. They tried to deploy SAP R/3, Manugistics SCM, and Siebel CRM simultaneously, compressing 48 months into 30, and went live during Halloween and Christmas season. The result: roughly $100M in unfulfilled orders despite having the products sitting in their warehouses.
Why the analytics layer falls outside everyone’s scope
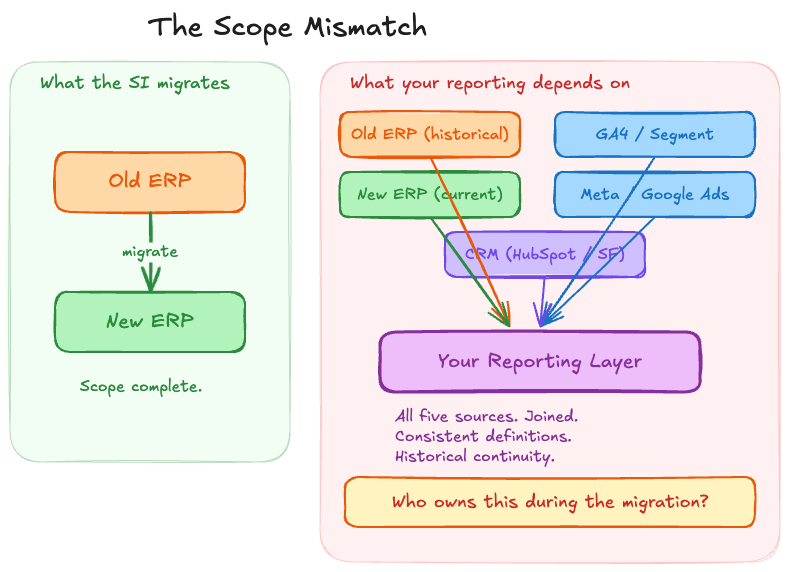
The Scope Mismatch
Your SI migrates one system. Your reporting depends on many. This is not a planning failure. It is how ERP migration projects are scoped.
ERP migration consultants focus on data cleansing, data mapping, master data harmonisation, cutover testing, and go-live validation. Standard guidance from SAP, NetSuite, and Wipro all suggest that data critical to analytics should be staged in a separate database rather than forced into the new ERP. The analytics layer is explicitly outside the vendor’s scope.
ERP-native reporting is not enough
ERPs are transactional engines. They process orders, manage inventory, handle accounting. They are not analytical platforms. Running complex analytical queries against an ERP database degrades the performance of the operational system.
NetSuite’s SuiteAnalytics shows what this looks like in practice. Reports are tied to specific modules: GL, AP, CRM. Core SuiteAnalytics only queries NetSuite data. Performance lags with complex joins. There are no true pivot tables in saved searches. For reporting that spans sales, marketing, and finance data, you need a warehouse with a reporting layer on top.
In a 2024 BlackLine survey, nearly 40% of CFOs said they do not fully trust their financial data. That is before a migration disrupts the system producing it.
Shopify makes attribution look easy. It is not.
Shopify uses last-click attribution by default. The sale goes to the final touchpoint before purchase. Meanwhile, Meta claims the sale with 7-day click / 1-day view. Google Ads claims it with data-driven attribution and a 90-day lookback. TikTok claims it with 7-day click / 1-day view. Each platform attributes the same conversion to itself.
The gaps are measurable, and bigger than most people expect. Up to 40% of Shopify store traffic shows as “Direct” when it actually came from Instagram, email, or Google Ads. That alone would be bad enough. But on average, 20 out of every 100 Shopify orders never appear in Google Analytics at all, because of thank-you page abandonment, ad blockers, and third-party checkouts like PayPal and Klarna.
The result: scaling brands spend 10 to 15 hours every week reconciling Shopify data with ad spend, CDP, and finance systems. That is a full-time analyst doing nothing but stitching spreadsheets together.
The identity resolution problem underneath all of this
Joining ERP transactional data with web analytics means matching anonymous web users to known customers. 60% of marketers say their biggest challenge is connecting the dots across channels. The industry standard for visitor recognition is 5 to 15% of total traffic. That means 85 to 95% of visitors remain anonymous.
The mismatch goes deeper. ERP data is structured around business entities: customers, orders, invoices with composite keys. Web analytics is event-based: pageviews, clicks, sessions with timestamps. Ad platforms use campaign-centric models: impressions, clicks, conversions with attribution windows. These are different data models with different time granularities, different update frequencies, and different schemas. You cannot naively join them. Today’s consumers interact with brands across an average of 9.5 touchpoints before converting.
Only 8% of companies have a fully unified view of their marketing performance across channels.
GDPR makes this harder in Europe
Under GDPR, websites must block all non-essential cookies until users give explicit consent. No implied consent, no pre-ticked boxes. Users who reject tracking create permanent attribution blind spots. A 2024 Journal of Marketing Research study analysing 3.7 billion ad impressions found GDPR compliance reduced display advertising effectiveness, with forecasts predicting up to 17% annual ad revenue losses.
The data warehouse strategy: decouple analytics from your ERP before you migrate
The parallel running pattern
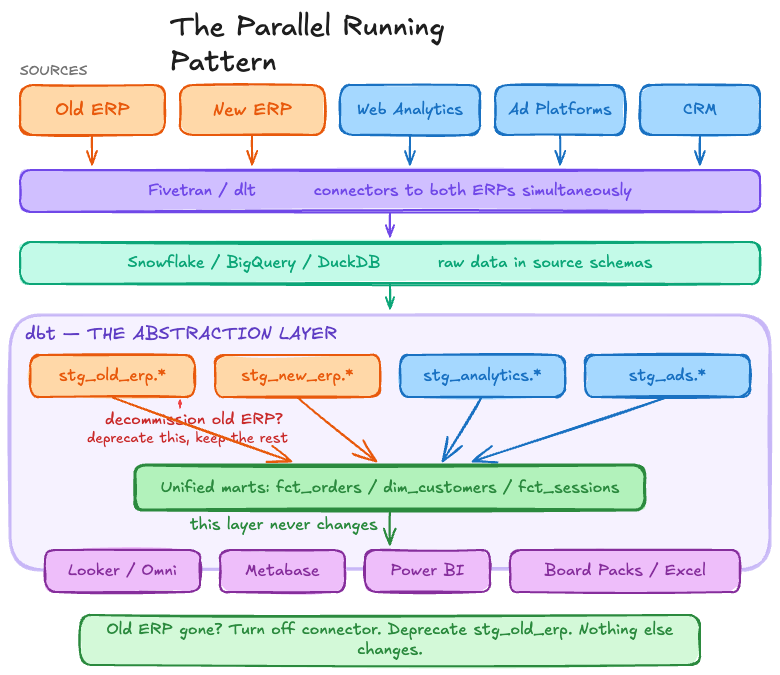
Decommission old ERP? deprecate stg_old_erp, keep the rest.
Build an independent data warehouse. It sits outside your ERP, stores data from both the old and new systems, and keeps your reporting alive through the entire migration.
The pattern works like this. ELT tools (Fivetran, dlt) run connectors to both the old and new ERP at the same time, loading data into separate schemas in the warehouse. The transformation layer (dbt) maps both schemas into a single set of business-logic models. Dashboards and reports query the unified output. They never touch the source systems directly.
When the old ERP is finally decommissioned, you turn off its connector and deprecate the old staging models. The marts layer does not change. The BI layer does not change. The board pack does not change.
Rand Group puts it well: legacy data does not need to migrate into the new ERP, the new ERP runs faster without historical data bloat, and the warehouse lets you swap ERP systems again in the future without touching your analytics.
Which warehouse?
The choice matters less than making it. Snowflake runs on AWS, Azure, and GCP with credit-based pricing ($2 to $4 per credit, $40/TB/month storage). BigQuery is fully serverless at $5/TB scanned on demand, with a free tier of 1 TB per month. Either works well for mid-market companies.
DuckDB with MotherDuck is the interesting outlier: open source, zero cost locally, with a cloud tier starting free up to 10 GB. One documented migration from Snowflake to DuckDB cut costs by over 70%. Worth considering for development and smaller datasets, though Snowflake or BigQuery remain the safer choices for production workloads at scale.
Your data model in dbt is the abstraction layer that survives ERP changes
dbt structures transformations in layers: staging, intermediate, marts. The staging layer handles column renaming, type casting, and schema normalisation. Everything above it is business logic. The dbt documentation describes this as moving data from source-conformed (shaped by external systems you do not control) to business-conformed (shaped by your own definitions and needs).
We call this business-conformed layer the domain model: a static target that describes the entities in your business and their relationships, independent of which source systems feed it. If you swap out a SaaS tool or an ERP, the domain layer absorbs the change. Nothing downstream needs to be rebuilt.
During migration, you maintain two staging model sets: one for the old ERP schema, one for the new. Both feed into the same intermediate and marts models. (For practical advice on managing multiple staging models efficiently, including state deferral and node selection, see our 10 essential dbt tips.) The dbt Semantic Layer (GA since October 2024) lets teams define metrics once on top of existing models and handles data joins automatically.
dbt’s traction validates the approach. dbt Labs passed $100M ARR in February 2025, up from $2M four years earlier. Over 5,000 paying customers in 43 countries, roughly 90,000 dbt projects in production. In October 2025, Fivetran and dbt Labs announced an all-stock merger to form a combined company with nearly $600M in annual revenue.
ELT tools connect ERPs to warehouses with ready-made connectors
Fivetran has connectors for SAP ERP (HANA, ECC on Oracle/NetWeaver, Business ByDesign), NetSuite (with dbt transformation packages for balance sheet, income statement, and transaction details), and Dynamics 365. The NetSuite dbt package works with both NetSuite and NetSuite 2, which makes version migrations straightforward.
dlt (data load tool) is the open-source Python alternative. 60+ verified source connectors, runs anywhere Python runs. Popular with data engineers and consultancies that want full control over their pipelines at lower cost.
BI tools sit on the warehouse, not on the ERP
When your BI tool connects to the warehouse’s marts layer, it is insulated from whatever happens to your source systems. Looker provides semantic modelling via LookML with strong BigQuery integration. Metabase is open source and runs at roughly a third of Looker’s cost. Omni Analytics (built by former Looker engineers) is warehouse-native with bidirectional dbt sync. Power BI fits well for organisations already on Microsoft.
Who has actually done this?
Grafana Labs migrated to NetSuite using Fivetran and dbt packages. Took 3 to 4 weeks, and saved up to 8 weeks of development time versus building from scratch.
Oldcastle Infrastructure had a harder problem: on-premises SQL Server and NetSuite running in parallel. They loaded both into Snowflake via Fivetran. All data replicated in 10 business days. Operating profit grew 21.5% that year.
The JetBlue example is useful for scale. They went from legacy SSIS pipelines to Snowflake + dbt, bringing in 26 data sources and building 1,200+ dbt models in 3 months. Before the migration, the warehouse was only live 65% of the time.
Gartner’s Composable Analytics research frames this as the direction the industry is heading: open, containerised analytics architecture where capabilities can be combined and recombined without being locked to a single vendor.
This is a permanent capability, not a one-off fix
The independent warehouse pattern survives every future system change. Swap CRMs. Add a new ad platform. Migrate e-commerce engines. The staging layer absorbs each change. The marts layer stays stable.
There is a second reason to get this right now. Gartner predicts 70% of organisations will lack AI-ready ERP data by 2027. A separate survey found 63% of organisations do not have (or are not sure they have) the right data management practices for AI. We hear this constantly from data leaders; at a recent London event, the consensus was that nobody trusts AI analytics yet, and the root cause is almost always data quality. Getting the data foundation right during migration is not only about preserving your current reporting. It is about building the infrastructure that makes AI analytics possible.
We have built analytics layers alongside ERP migrations at mid-market clients, including building data foundations for PhotoRoom’s post-Series B reporting. Sprint-based delivery means the data warehouse is live before the ERP goes live.
Planning an ERP migration? Your reporting does not have to break. Talk to us about your data infrastructure.
Frequently asked questions
What happens to reporting during an ERP migration?
Your dashboards, board packs, month-end close reports, and ad-hoc analysis all depend on the ERP being replaced. During migration, the chart of accounts changes, historical data may not transfer, and KPI definitions shift. The hard cutover blackout lasts 1 to 3 days, but the effective reporting gap, where teams lack full visibility and fall back on spreadsheets, typically runs 2 to 6 months.
Do I need a data warehouse for an ERP migration?
Not technically, but without one your reporting is coupled to your ERP. When the ERP changes, reporting breaks. An independent data warehouse (Snowflake, BigQuery, or DuckDB) stores data from both old and new systems, letting you run reports from a stable layer that does not change during cutover. It also means your historical data does not need to migrate into the new ERP at all.
How do you run old and new ERP systems in parallel for reporting?
Use ELT tools (like Fivetran or dlt) to run connectors to both ERPs at the same time, loading into separate schemas in the warehouse. A transformation tool like dbt maps both schemas into unified business-logic models. Dashboards query the unified output. When the old ERP is decommissioned, you turn off its connector and deprecate its staging models. Nothing downstream changes.
Why is Shopify attribution unreliable during ERP migration?
Shopify uses last-click attribution and tracks sessions, not individual customers. Up to 40% of traffic can be misattributed as “Direct”, and 20% of orders may not appear in Google Analytics at all. During an ERP migration, the system that could at least reconcile order data is itself in flux, compounding the problem. A central warehouse with unified identity resolution is the only way to get a clean picture.
How long does it take to build an independent data warehouse alongside an ERP migration?
Published case studies suggest 3 to 10 weeks depending on complexity. Grafana Labs built their NetSuite warehouse integration in 3 to 4 weeks using Fivetran and dbt. Oldcastle Infrastructure replicated data from two ERPs (on-premises SQL Server and NetSuite) into Snowflake in 10 business days. The key is starting before the ERP cutover, not after.